When their prices are connected, they produce a marvelous indicator of how the markets and interest rates in particular are doing

Strictly speaking, gold and copper prices do not have any fundamental relationship to each other. That being said, gold and copper do tend to move in the same direction most of the time. However, when their prices are connected, they produce a marvelous indicator of how the markets and interest rates in particular are doing. More importantly, they are good indicators for what the markets and rates will likely do in the future. It is this directional trend that holds the key to their insight. 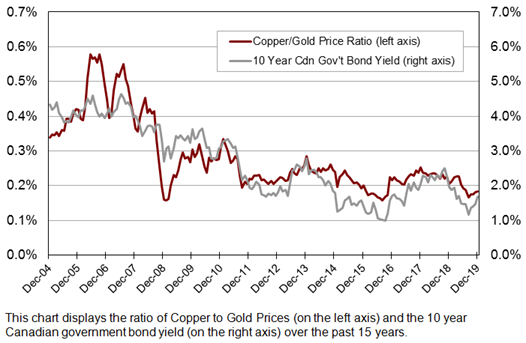
Gold is considered a safe haven for investors, a warehouse of value. It is generally a useless metal from an industrial perspective with most of its value being shaped by interest rates and inflation expectations. A rising gold price signals either an economy contraction or an increasing fear of a contracting economy. So, during times of economic and geopolitical distress it generally tends to perform well, making it a leading indicator of fear. On the other hand, gold prices tend to fall when the economy is humming along nicely.
Copper is the exact opposite; it is a key industrial metal that is used almost entirely for industrial consumption, with more than 65% of it going directly into building construction and electronics. It performs strongly when the global economy is firing on all cylinders. This makes it an accurate barometer of global growth. Additionally, the copper market tends to be more volatile and sensitive to price swings.
 The yield on 10 Year Canadian government bonds are important because they tend to rise during economic expansion as investors’ inflation expectations rise; and fall when the opposite scenario comes into play. Thus, the copper/gold price ratio should also tend to increase when the economy is expanding or falling based on the state of the world economy.
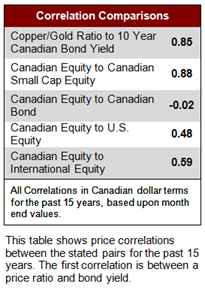
The copper/gold ratio is an important key indicator that gauges global economic health. The copper/gold ratio is calculated by dividing the market price of an ounce copper by the market price of an ounce of gold. Interestingly, the copper/gold ratio is highly correlated (currently, the correlation stands at 0.85) and therefore a powerful coincident indicator for 10 Year Canadian government bond yields. To put this in perspective, the monthly correlation over the past 15 years for Canadian equity to Canadian bonds is -0.02; for Canadian equity to U.S. equity (in C$ terms) is 0.48; and for Canadian equity to International equity (in C$ terms) is 0.59. So, the copper/gold ratio is extremely meaningful indicator.
As you can see in the chart above right the 10 Year Canadian government bond yield has exhibited a very similar trend to the copper/gold ratio since 2004. Over the last 5 years in particular this ratio has been meandering within a tight range. However, over the past 6 months the rising copper/gold ratio suggests that demand for copper is increasing, which is boosting prices. The rising demand for this key industrial metal signals that economic activity may be picking up, which would create an inflationary situation.
Of course, this should imply that bond yields will rise, meaning bonds will fall in value. Sure enough, this is essentially what is happening and even appears to have been accelerating over the past few months. If this pattern holds true, then this will be very positive for the state of the world’s economy.
SPONSORED BY:
.jpg "Provisus Wealth Management")