Why are investors still waiting for a correction? Some investors would like to see a pullback to cool off the white hot equity markets, but they may have to wait a little longer
 s because without a yield curve inversion there will be no correction. This mantra remains as true today as it did 47 years ago. The yield curve is one of the most reliable economic indicators and one that savvy market watchers always keep on their radar. Sure this bull market may be long in the tooth, but the Canadian stock market just reached its first all-time high since 2008.
 The yield curve indicates the difference between short term cash yields and long term bond yields. It is an excellent tool for predicting the direction of the economy. Typically, short term interest rates are lower than long term rates, so the yield curve slopes upwards, reflecting higher yields for longer term investments. This is referred to as a normal yield curve. When the spread between short and long term interest rates narrows, the yield curve begins to flatten. Lastly, when short term rates move above long term rates the curve becomes inverted and this is a major signal that a slowdown is likely. It is no wonder that an inverted yield curve produces so much fear.
The yield curve has an excellent track record of predicting the top of the stock market over the past 47 years and it is not signaling a bear market now. We are currently in the longest period without an inversion since 1970; while concerning for its longevity, it does not mean much since an actual inversion is the only true signal. The yield curve inversion usually takes place about 12 months before the start of a recession, but the lead time ranges from 5 to 16 months. The peak in the stock market comes around the time of the yield curve inversion, just ahead of a recession.
 The chart to the right illustrates the spread between 3 month T-bills and 10 year bonds for the past 47 years and when that differential has turned negative (or inverted). The chart also compares this spread to movements in the S&P/TSX Stock index. The yield curve had been flattening until August 2016 as bond investors started to worry about when the Bank of Canada (BOC) would begin hiking its lending rate. Since then the curve has moved upward as longer bond yields have increased while short term rates remained steady. It appears that we are still a long ways from inverting. If the BOC aggressively hikes its key policy rate and short term yields rise swiftly, they would have to increase yields by 1.1% (assuming bond yields stay the same) before the yield curve becomes inverted. This will likely not occur quickly; as the consensus remains that the next hike is a long way off.
Investors may hear cries from many circles to ignore the yield curve and that “it has lost its edge” as a leading indicator. Do not believe them; it has called each of the last 10 recessions since World War II with precision. The yield curve is an invaluable forecasting tool for predicting recessions and stock market corrections and is equally as important for what it predicts when it is not inverted: a bull market or continued strong period for equities. So based upon what the yield curve is telling investors currently, this bull market has more room to run because a bear market will not come until the yield curve says so.
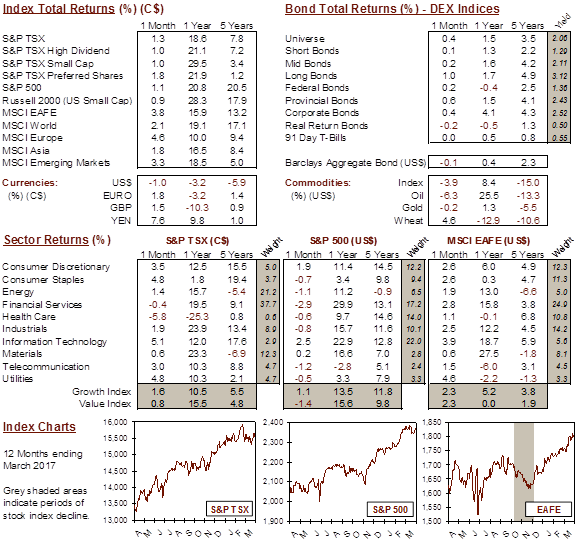
Market Data
This report may contain forward looking statements. Forward looking statements are not guarantees of future performance as actual events and results could differ materially from those expressed or implied. The information in this publication does not constitute investment advice by Provisus Wealth Management Limited and is provided for informational purposes only and therefore is not an offer to buy or sell securities. Past performance may not be indicative of future results.
While every effort has been made to ensure the correctness of the numbers and data presented, Provisus Wealth Management does not warrant the accuracy of the data in this publication. This publication is for informational purposes only.
For more information, visit transcend.ca. Financial advisors can visit transcend.ca/advisor
SPONSORED BY:
.jpg "Provisus Wealth Management")