Head of ETF strategy at Franklin Templeton, Alex Lee, on how the new market cycle takes cash off the sidelines

This article was produced in partnership with Franklin Templeton
Investors work hard. So why should their cash be any different? While volatile fixed income markets and rising yields led investors to shelter in cash during recent years, we think that markets have finally come to a place where it makes sense to start putting cash back to work. Let’s get into it!
Interest rates have peaked.
You already know the story of how we got here.
High inflation triggered aggressive interest rate hikes, which wreaked havoc on fixed income markets. In this backdrop, cash was appealing as it allowed for defensiveness and attractive income. But the environment has changed. Canada has made progress on inflation, and interest rates have held steady since July 2023.
Market participants are now debating the number of rate cuts that could happen this year, as the five percent policy rate seems restrictive when compared to the recent January Consumer Price Index of 2.9 percent. Based on the Overnight Index Swaps (OIS), the market is leaning towards three rate cuts of 25-bps by the end of 2024 in Canada, which would imply a policy rate close to 4.25 percent as of February 29, 20241.
As markets brace for a new stage of the cycle, it may be wise for investors to think about whether sheltering in cash still makes sense, especially with new opportunities in bonds on the horizon.
Where do risk-averse investors go from here?
We have two solutions for clients in cash looking to increase their upside potential while maintaining a low risk profile.
Franklin Bissett Ultra Short Bond Fund ETF (FHIS)
Franklin Bissett Short Duration Bond Fund ETF (FLSD)
Both strategies are actively managed by the Bissett Fixed Income team and offer an attractive yield with a high credit quality of ‘A’.2
Why FHIS?
The highest yield opportunities in Canada are currently in ultra-short-term bonds on the yield curve, as investors aren’t yet being rewarded with term premium to extend duration.
Government of Canada Yield Curve (%)
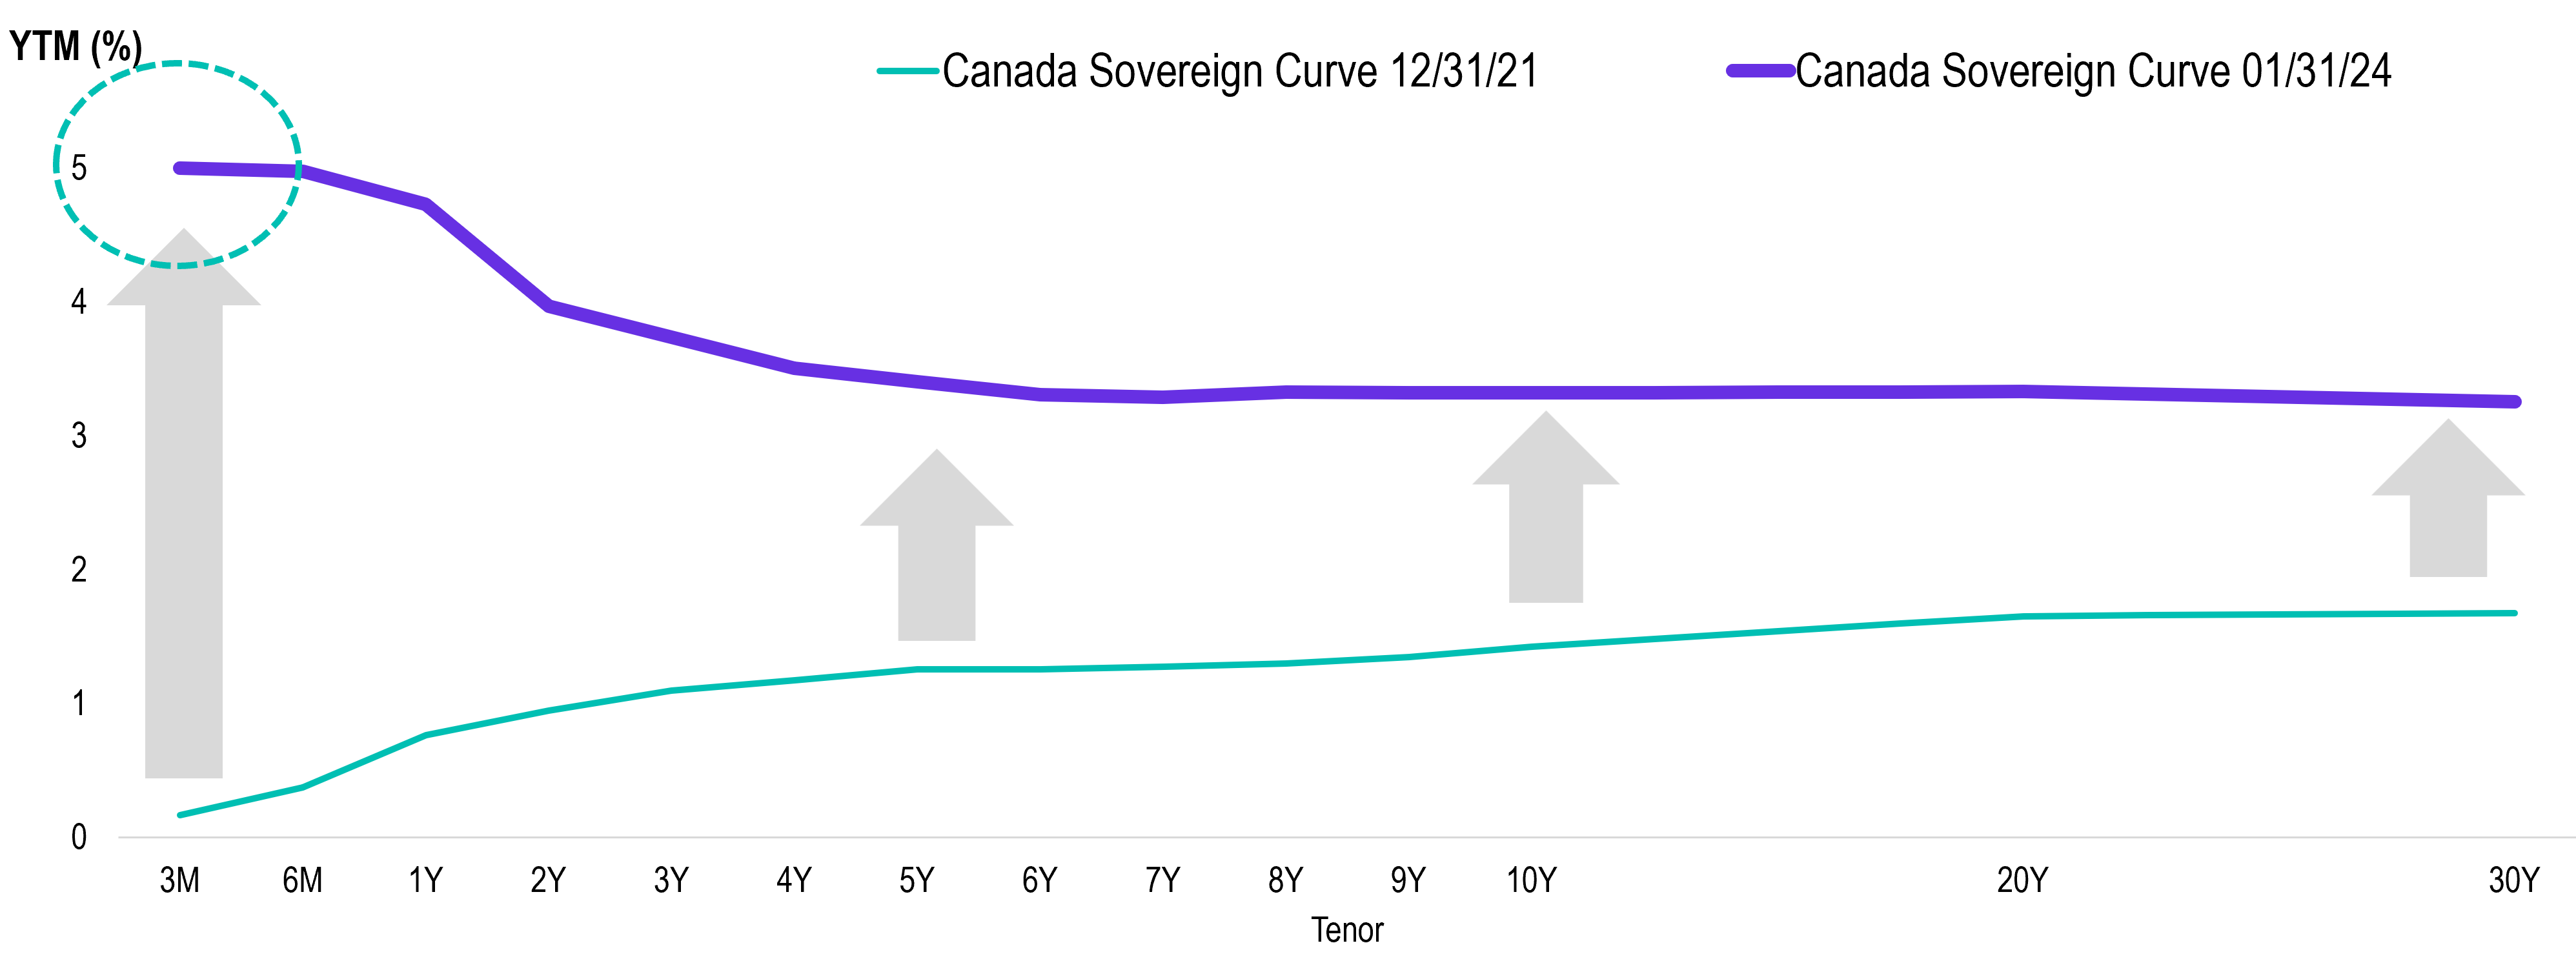
Specifically launched in 2022 to help investors manage increased volatility related to interest rates, FHIS offers one of the best ways for investors holding cash to migrate into fixed income without taking on too much interest rate risk, as the average duration has remained below one year since inception.
It currently boasts duration under six months and a yield of 5.43 percent2, which is higher than many cash ETFs in the Canadian market today3. It also has a low fee of 15-bps as an actively managed solution, which is priced similarly to some cash and money market ETF offerings.
Since its inception, the portfolio management team has done a great job navigating a challenging environment, resulting in a positive return every month since the inception period.
Cumulative Total Return Since Common Inception (%)
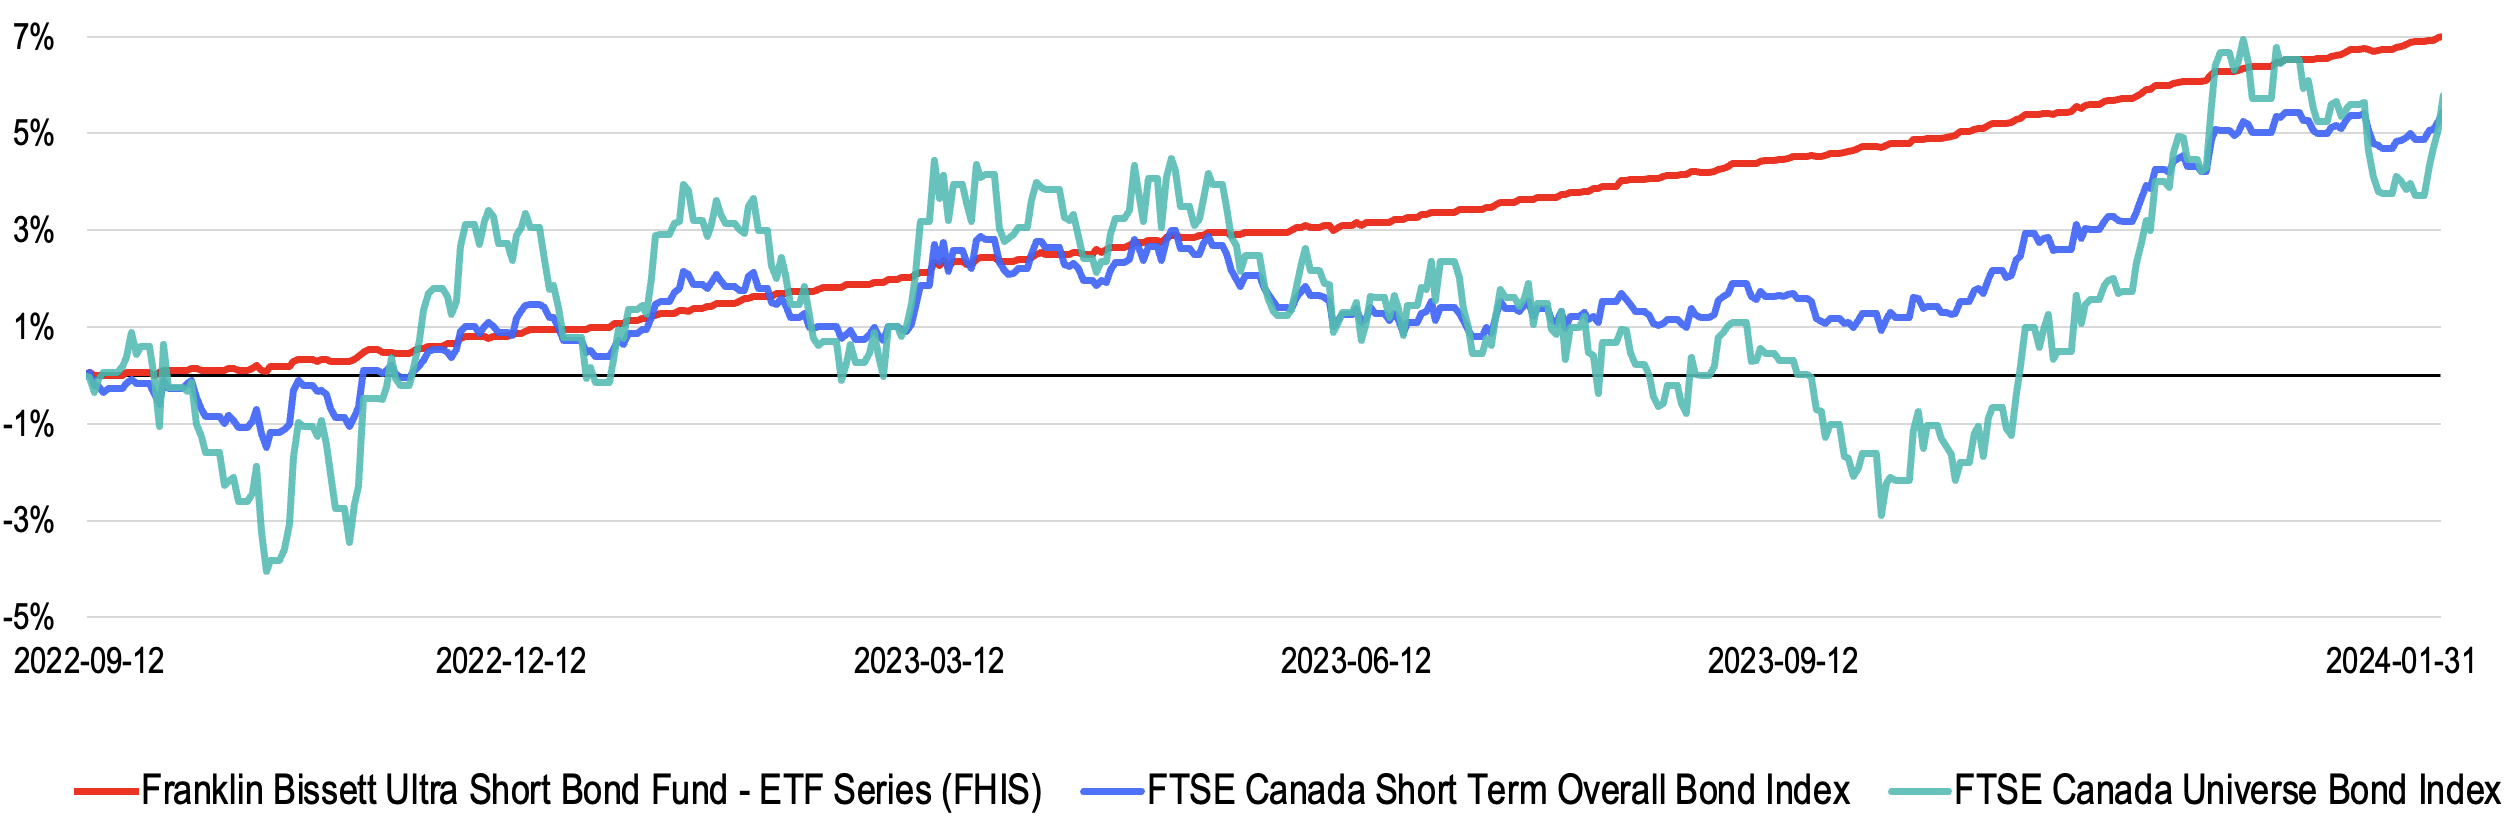
Source: Morningstar Research Inc., as of January 31, 2024. Common Inception Date: Sept 12, 2022.
These consistent returns have taken away the timing risk for investors. With its history of limited drawdown, defensive characteristics, and active management, we continue to like FHIS to reduce volatility as part of a broader fixed income portfolio.
Drawdown Since Common Inception (%)
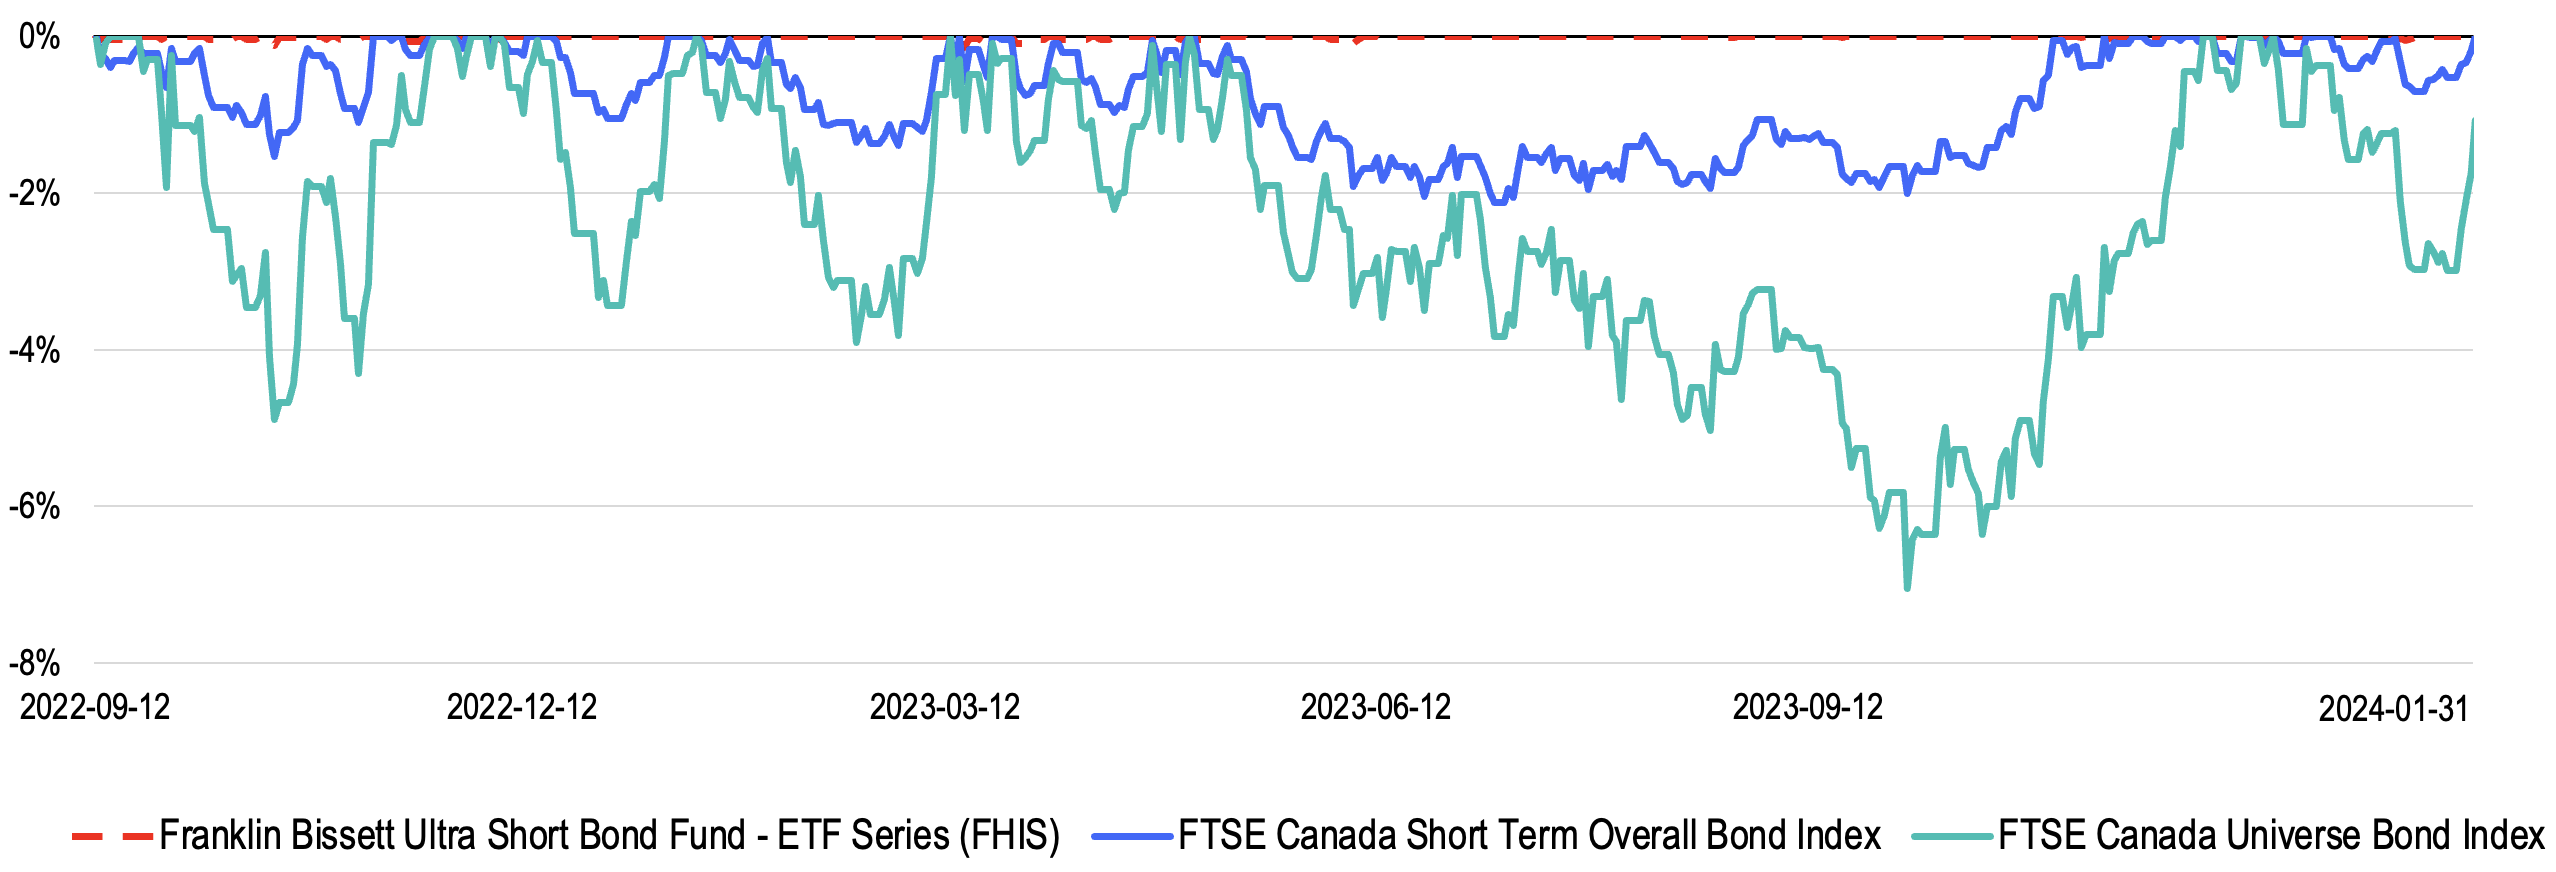
Source: Morningstar Research Inc., as of January 31, 2024.
FHIS seeks to take advantage of opportunities in the ultra-short-term space, and has consistently generated alpha compared to the benchmark.
|
|
YTD |
1 month |
3 months |
6 months |
1 year |
Since Common Inception |
|---|---|---|---|---|---|---|
|
Franklin Bissett Ultra Short Bond Fund - ETF Series (FHIS) |
0.43% |
0.43% |
1.66% |
3.05% |
5.33% |
4.95% |
|
FTSE Canada 0-1 Year Universe Overall Bond Index |
0.40% |
0.40% |
1.37% |
2.74% |
4.92% |
4.51% |
Source: Franklin Templeton, as of January 31, 2024. Common Inception Date: Sept 12, 2022.
WHY FLSD
FLSD can provide an attractive yield opportunity with limited interest rate risk, while reducing reinvestment risk typically associated with cash instruments if rate cuts start to take place.
Potential rate cuts in the second half of this year pose a problem for investors in cash, as yields may decline in line with rate cuts. Since FLSD has an average maturity of 3.7 years2, investors can take advantage of higher yields for longer, without overreaching on interest rate risk.
For clients comfortable with some interest rate risk, FLSD provides a yield of 5.26% with a short duration of 2.78 years2. Given that the yield curve remains inverted, the strategy also has a higher yield-to-maturity compared to the bond universe and to the benchmark.
|
|
FLSD |
Benchmark |
Bond Universe |
|---|---|---|---|
|
Credit Quality |
A |
AA |
AA- |
|
YTM |
5.26% |
4.31% |
4.17% |
|
Duration |
2.78 Years |
2.55 Years |
7.18 Years |
Source: Franklin Templeton and Morningstar Research, as of January 31, 2024. Benchmark is represented by FTSE Canada Short Term Overall Bond Index. Bond Universe is represented by FTSE Canada Universe Bond Index.
During the past three years, FLSD managed to outperform both its benchmark and the bond universe, with less than half the volatility of the bond universe. It also has a down capture ratio of only 26% while capturing close to 39% upside of the bond universe during the same period.
|
Return |
Standard Deviation |
Sharpe Ratio |
Up Capture Ratio |
Down Capture Ratio |
Correlation |
Average Drawdown |
Max Drawdown |
|
|---|---|---|---|---|---|---|---|---|
|
FLSD |
0.44 |
2.76 |
-0.73 |
39.15 |
25.75 |
0.92 |
-2.25 |
-5.73 |
|
Benchmark |
-0.16 |
2.88 |
-0.91 |
37.63 |
29.81 |
0.91 |
-2.40 |
-5.75 |
|
Bond Universe |
-2.89 |
7.19 |
-0.71 |
100.00 |
100.00 |
1.00 |
-6.61 |
-14.23 |
Source: Morningstar Research Inc. and Franklin Templeton, as of January 31, 2024. Total return in Canadian Dollars based on monthly return. Benchmark is represented by FTSE Canada Short Term Overall Bond Index. Bond Universe is represented by FTSE Canada Universe Bond Index.
FLSD has consistently outperformed the benchmark with a strong investment process, and the team has the flexibility of the plus component to generate alpha.
|
|
YTD |
1 month |
3 months |
6 months |
1 year |
3 years |
Since Common Inception |
|---|---|---|---|---|---|---|---|
|
Franklin Bissett Short Duration Bond Fund - ETF Series (FLSD) |
0.29% |
0.29% |
3.73% |
4.32% |
4.59% |
0.44% |
1.82% |
|
FTSE Canada Short Term Overall Bond Index |
-0.18% |
-0.18% |
3.12% |
3.88% |
3.42% |
-0.16% |
1.25% |
Source: Franklin Templeton as of January 31, 2024. Common Inception Date: July 8, 2019.
Final word
We acknowledge the key role that cash instruments played during an aggressive rate hike cycle, but we remain optimistic on the fixed income market. Barring a shocking turn of events, we believe that a broader interest rate drawdown is getting closer. Falling rate environments will likely create compelling new opportunities in fixed income, and investors bunkering in cash should give that some real thought.
If you have clients ready to debunk some cash to increase their portfolio’s upside, we’ve highlighted two solutions capable of doing exactly that, while maintaining a low risk profile.
To learn more about FHIS – click here.
To learn more about FLSD – click here.
- Bloomberg L.P. as of February 29, 2024.
- Franklin Templeton as of January 31, 2024.
- “Product Review: Review of Cash Alternative and Money Market ETFs in Canada (ETF Research & Strategy)” published by National Bank ETF research team on February 28, 2024 based on data as of January 31, 2024.
IMPORTANT LEGAL INFORMATION
Alex Lee’s comments, opinions and analyses are for informational purposes only and should not be considered individual investment advice or recommendations to invest in any security or to adopt any investment strategy. Because market and economic conditions are subject to rapid change, comments, opinion, and analyses are rendered as of the date of the posting and may change without notice. The material is not intended as a complete analysis of every material fact regarding any country, region, market, industry, investment or strategy.
All investments involve risks, including the possible loss of principal. Investments in foreign securities involve special risks including currency fluctuations, economic instability and political developments. Investments in emerging markets, of which frontier markets are a subset, involve heightened risks related to the same factors, in addition to those associated with these markets’ smaller size, lesser liquidity and lack of established legal, political, business and social frameworks to support securities markets. Because these frameworks are typically even less developed in frontier markets, as well as various factors including the increased potential for extreme price volatility, illiquidity, trade barriers and exchange controls, the risks associated with emerging markets are magnified in frontier markets. Stock prices fluctuate, sometimes rapidly and dramatically, due to factors affecting individual companies, particular industries or sectors, or general market conditions.
Any statement that necessarily depends on future events may be a forward-looking statement. Forward-looking statements are not guarantees of performance. They involve risks, uncertainties and assumptions. Although such statements are based on assumptions that are believed to be reasonable, there can be no assurance that actual results will not differ materially from expectations. Investors are cautioned not to rely unduly on any forward-looking statements. In connection with any forward-looking statements, investors should carefully consider the areas of risk described in the most recent simplified prospectus.
Commissions, management fees and expenses may all be associated with investments in ETFs. Investors should carefully consider an ETF’s investment objectives and strategies, risks, fees and expenses before investing. The prospectus and ETF facts contain this and other information. Please read the prospectus and ETF facts carefully before investing. ETFs trade like stocks, fluctuate in market value and may trade at prices above or below the ETF’s net asset value. Brokerage commissions and ETF expenses will reduce returns. Performance of an ETF may vary significantly from the performance of an index, as a result of transaction costs, expenses and other factors. The indicated rates of return are the historical annual compounded total returns including changes in share or unit value and reinvestment of all dividends or distributions and do not take into account sales, redemption, distribution or optional charges or income taxes payable by any securityholder that would have reduced returns. ETFs are not guaranteed, their values change frequently, and past performance may not be repeated.
Prior to August 8, 2023, Franklin Bissett Ultra Short Bond Fund was formerly known as Franklin Bissett Ultra Short Bond Active ETF.
CFA® and Chartered Financial Analyst® are trademarks owned by CFA Institute.
Franklin Templeton Canada is a business name used by Franklin Templeton Investments Corp.
© 2024 Franklin Templeton. All rights reserved.