Most investors know that passive Exchange Traded Funds (ETFs) are low cost investment vehicles, correct? Well, almost right!

Most investors know that passive Exchange Traded Funds (ETFs) are low cost investment vehicles, correct? Well, almost right! Passive ETFs are “designed” to track a benchmark index or market at a low cost. ETFs may be relatively cheap from a Management Expense Ratio (MER) perspective but the costs don’t stop there. Putting aside the negative impact of brokerage costs and potential custodian or registration fees, ETFs in the majority of instances still underperform their underlying benchmark. So, the cost of owning any investment vehicles should be understood in terms of investment returns because the underlying fees can also be a drag on performance.
While ETFs ownership is growing, Mutual and Segregated funds are still the predominate investment for retail investors. There have been countless studies concerning the weak investment returns of funds in Canada relative to their benchmarks, however a new approach has been developed by S&P Dow Jones Indices. The SPIVA Canada Scorecard quantifies the mutual fund industry’s peccadilloes. In its own words, it “reports on the performance of actively managed Canadian mutual funds versus that of their benchmarks. The SPIVA Scorecards are the de facto scorekeepers...” The latest result based upon five years of data confirms that equity mutual funds have underperformed their benchmark, often because of fees.
Investors should determine if they are getting what they are paying for by tracking the difference between an ETF’s performance and the benchmark’s performance. The resulting Tracking Difference is seldom zero. This is easy to find as ETFs are required to file a Management Report of Fund Performance (MRFP) twice a year on the SEDAR.ca website. Other factors could impair returns such as the trading and rebalancing costs which occur when ETFs realign themselves as indices adjust their holdings, sampling issues that occur when it is impractical to hold every security in the index and there is a cash drag between when the ETF receives dividend and interest payments and when it then distributes them to shareholders. A recent 2019 study by ETF.com has indicated that the average Bid/Ask spread across more than 2,200 U.S. ETFs was 0.48%. This spread is another significant cost to trading ETFs and will continually detract from performance whenever trading occurs. U.S. fixed income ETFs tend to have the lowest spreads of 0.17%; while all other ETFs average spreads range from 0.24% to 0.56%.
Additional costs can detract from performance as the chart above shows the percentage cost associated with investing in these investment vehicles. The table to the left shows the pro-rata weighting MER and Tracking Difference for the Top 100 ETFs and their major asset subcategories. In Canada, there are more than 830 ETFs as of March 31, 2019 but the largest 100 represent over 70% of all the invested assets. Interestingly, the average MER across the entire Top 100 ETFs is 0.31% (individual MERs ranged from 0.05% to 1.29%). These numbers have remained very consistent over the past three years. By gathering both the MER, Tracking Difference and we are able to see how much of the underperformance is attributed to these costs.
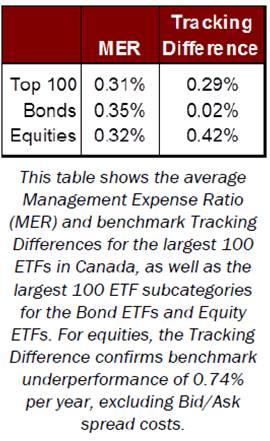 This table shows the average Management Expense Ratios (MER) and benchmark Tracking Differences for the largest 100 ETFs in Canada, as well as the largest 100 subcategories ETFs of the Bond ETFs and Equity ETFs. For Equities the Tracking Difference confirms that they underperformed their benchmark by 0.74% per year, excluding the Bid/Ask spread costs. The reality is that most cases the total cost of investing in many investment products leads to investment under performance when measured against the benchmark. This cost/weakness is much more than most investors know about or expect.
Provisus Platform Traded Funds (PTFs)
However, there is an entirely new investment vehicle that has very low fixed fees, but seeks above benchmark returns and only charges higher fees when they are achieved: Provisus PTFs (Platform Traded Funds) on NEO. The Provisus PTFs trade on the exchange much like ETFs but execute based on a NAV like a mutual fund instead of on a bid-ask spread. These PTFs have a unique fee structure that is “Actively Managed, but Passively Priced.” Our management fee is a low 0.25% (with no additional charges for trading, custodial & marketing fees) which is 26% less than the average equity ETFs fees. When these PTF’s outperform their pre-set benchmark then clients will pay a performance fee of 20% of the outperformance. This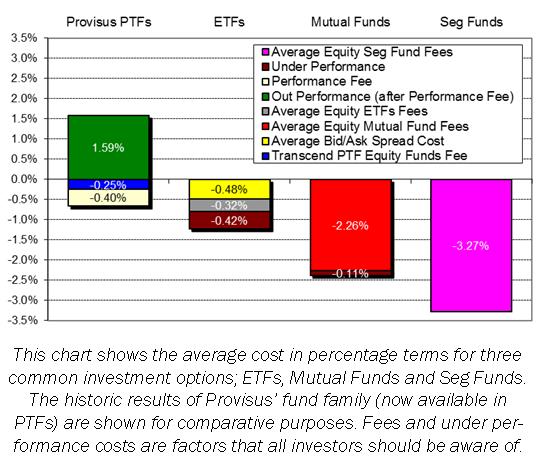 performance fee directly aligned to the manager’s ability to add value, while offering clients the opportunity do better than passively managed ETFs.
For most investors the objective is to earn value added performance. However, fees and other costs can sap returns. The aim of a Passive ETF is to mirror its benchmark so they are not designed to outperform. Get the best of both worlds with low cost Provisus PTFs.
For more information, visit provisus.ca. Financial advisors can visit provisus.ca/advisors
SPONSORED BY:
.jpg "Provisus Wealth Management")