Predicting what will happen in the stock market is virtually impossible

Historically there has been no significant difference between the performance of the stock market regardless of which political party was holding the U.S. presidency. As all investors know, predicting what will happen in the stock market is virtually impossible. Still, it is interesting to scrutinize historical data and see what trends emerge. For example, the S&P/TSX Composite Index during the 17 election years since 1952, has had only four negative years. Historically, the most profitable year of a presidential cycle has been the third year (2019 falls into this category). Interestingly, there appears to be a significant difference in performance depending upon which political party wins the presidency from the other party in the year of an election versus the following year.v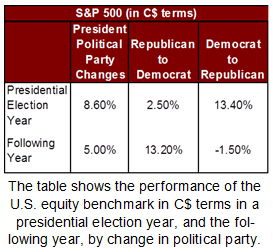
During the years when there is a presidential election going back to 1952, the S&P/TSX Total Return index has been in the positive 76% of the time (13 out of 17 years). The average return during each of the 17 election years was 10.8%, which trailed the 11.2% gain for the index during all 69 years. The chart to the right shows how the Canadian stock market has performed in various scenarios; while the table to the left shows exactly the same set of data while using the S&P 500 Total Return stock index returns (in Canadian dollar terms).
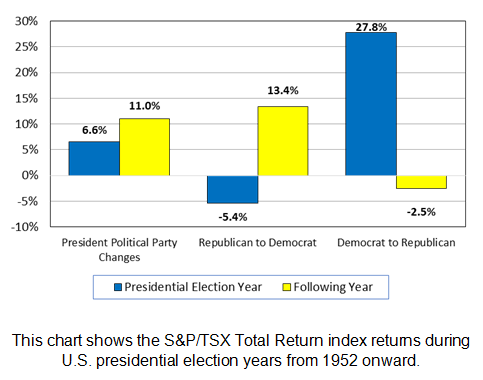 On average, the S&P/TSX Total Return index increased in value by 11.0% in the first post election year when the political party of the United States’ President transitioned from one party to another. The year during an election before the transition occurred the Canadian stock market only gained 6.6%. However, this included the -33.0% loss in 2008 during the Democratic Obama transition due to the stock market crash.
It’s interesting to look at what happens in the first post election year when the political party of the President shifted from a Republican to a Democrat. The S&P/TSX Total Return index was positive during the first post-election year with the average price increase equaling 13.4%. However, in the election year itself the market lost 5.4%.
When a Republican was elected President, the average return in the first year after the change amounted to 2.5% loss. Keep in mind that this represents a stark contrast to the price change for the S&P/TSX Total Return index during the election year with a mammoth 27.8% average annual returns. This data would tend to contradict the stereotypical line of thinking is that Republicans are "better for the markets" because they tend to push for more pro-business policies (i.e. lower taxes and less regulation).
Of course, both good and bad stock market performance in the year before or after an U.S. presidential election likely has less to do with the president's party and more to do with what was going on in the economy. Therefore, the problem with investing based on such data patterns is that it is not a good way to go about making investment decisions. While it might be exciting, there are no guarantees as there are too many other forces that alter market conditions.
SPONSORED BY:
.jpg "Provisus Wealth Management")